|
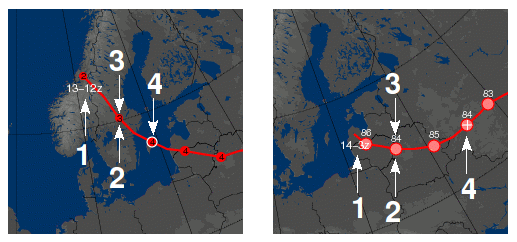
1. Methodology:
These maps are generated using the tracking algorithm originally developed by:
Sinclair, M. R., 1997: Objective identification of cyclones and their
circulation intensity, and climatology. Wea. Forecasting, 12, 595–612. E-T cyclones are tracked base on either their minimum central MSLP (mean sea level pressure) or on their maximum values of gradient wind vorticity.
For vorticity based tracking, cyclones (i.e. vorticity maxima) must reach a given threshold value (at 1000 hPa: +0.75x10⁻⁵ s-1, at 500 hPa: +1.5x10⁻⁵ s-1). Vorticity fields are smoothed using a Cressman filter with a smoothing radius of 800 km to removed (real and ficticious) small scale details and retain only the synoptic scale features. For pressure based traking, cyclone centers are determined from filtered MSLP fields obtained with a Cressman filter and a smoothing radius of 300 km. However, the minimum central pressure values mapped are the raw MSLP values at the center locations found in the filtered MSLP fields. In all cases, cyclones must last at least 24 h to be considered. 2. Trajectory maps description: 
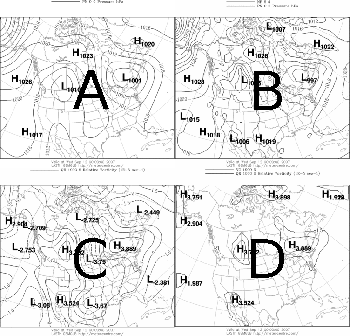
3. 4-panel animation description: Animation every 6h showing :  B-
Original (i.e. without filtering) mean sea level pressure (or 500 hPa heights)
C- Gradient wind vorticity after filtering D- Gradient wind vorticity after filtering greater than the threshold value of +1,5x10⁻⁵ s-1 |